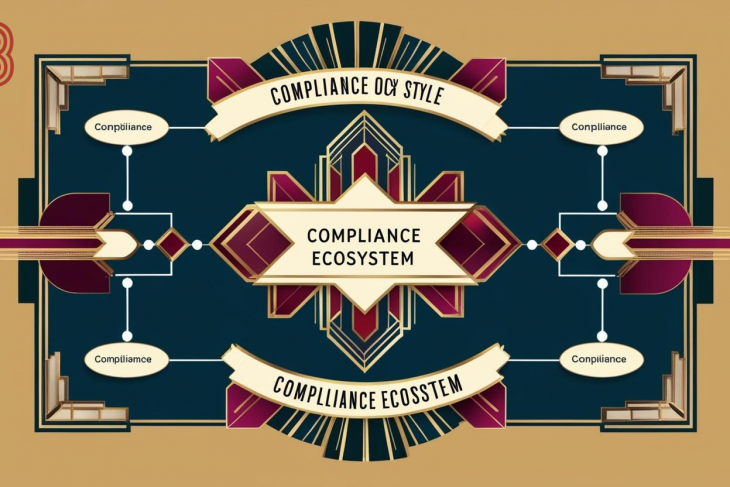
The method derives its name from the bow tie shape formed when mapping out these elements. On the left side of the diagram, the causes or threats lead to a central hazard (the “knot” of the bow tie), while on the right side, the potential consequences flow from the hazard. Each side is linked to barriers or controls aimed at either preventing the risk from occurring or mitigating its effects.
Structure of Bow Tie Analysis
Hazard:
The central part of the diagram, representing the source of potential harm.
Threats:
The possible causes or events that could lead to the occurrence of the hazard. These are positioned on the left side of the diagram.
Preventive Controls:
These are barriers or measures on the left side of the diagram aimed at stopping the threats from materializing into the hazard.
Top Event:
The critical moment when the hazard is realized, usually at the center of the diagram.
Mitigating Controls:
These are the safeguards positioned on the right side that aim to minimize the impact if the hazard materializes.
Consequences:
These represent the outcomes or damages if the hazard occurs and are shown on the right side.
Benefits of Bow Tie Analysis
The BTA method provides clarity in visualizing complex risks and enables a better understanding of where controls are weak, missing, or need strengthening. It ensures that both proactive and reactive measures are considered, helping organizations not only prevent incidents but also prepare for managing them effectively. This method is widely used in industries like oil and gas, aviation, and healthcare, where managing critical risks is essential.
WWW.BARETZKY.NET


